

Machine learning and other gibberish
See also: https://sharing.leima.is
Archives: https://datumorphism.leima.is/amneumarkt/
See also: https://sharing.leima.is
Archives: https://datumorphism.leima.is/amneumarkt/
#data
Last year a colleague introduced Marimo to me. It was surprisingly good after the first few days but then I was annoyed by the auto rerun on expensive computations.
Then I bailed out.
This morning I read a blog on this topic and realized there's a switch...
Time to jump in again.
https://docs.marimo.io/guides/configuration/runtime_configuration/#disable-autorun-on-cell-change-lazy-execution
#data
Reciprocal Tariff Calculations | United States Trade Representative
https://ustr.gov/issue-areas/reciprocal-tariff-calculations
Reciprocal Tariff Calculations | United States Trade Representative
https://ustr.gov/issue-areas/reciprocal-tariff-calculations

#data
Do Not Use Azure. To be honest, I can't even name one good thing from Microsoft.
- By a person who is frustrated by Microsoft products including the sh*tty Windows OS.
https://www.reddit.com/r/dataengineering/s/G9uTQmVxWC
Do Not Use Azure. To be honest, I can't even name one good thing from Microsoft.
- By a person who is frustrated by Microsoft products including the sh*tty Windows OS.
https://www.reddit.com/r/dataengineering/s/G9uTQmVxWC


#data
How to run data science projects | Science & technology experiments
https://dzidas.com/ml/2024/10/22/implementing-data-science-projects/
How to run data science projects | Science & technology experiments
https://dzidas.com/ml/2024/10/22/implementing-data-science-projects/
#data
Interesting read
> we propose DATALORE, a framework that explains data changes between an initial dataset and its augmented version to improves traceability
https://www.amazon.science/publications/datalore-can-a-large-language-model-find-all-lost-scrolls-in-a-data-repository
Interesting read
> we propose DATALORE, a framework that explains data changes between an initial dataset and its augmented version to improves traceability
https://www.amazon.science/publications/datalore-can-a-large-language-model-find-all-lost-scrolls-in-a-data-repository

#data
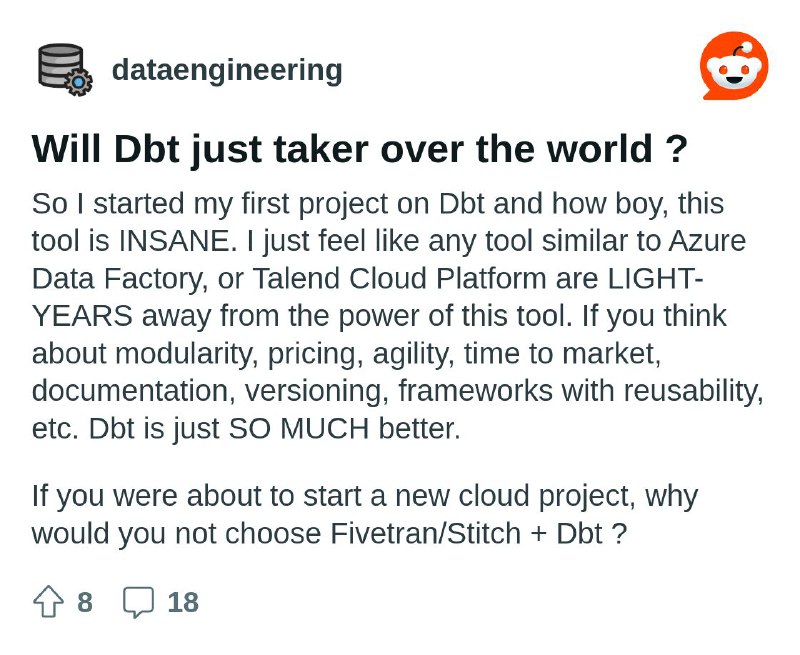
Never tried dbt but it is definitely popular judging by the amount of people talking about.
I read these discussions on Reddit and I think it is worth sharing.
https://www.reddit.com/r/dataengineering/s/tphxT7p0kI
and
https://www.reddit.com/r/dataengineering/s/YpOXP3y6av
Never tried dbt but it is definitely popular judging by the amount of people talking about.
I read these discussions on Reddit and I think it is worth sharing.
https://www.reddit.com/r/dataengineering/s/tphxT7p0kI
and
https://www.reddit.com/r/dataengineering/s/YpOXP3y6av
#data
Quite useful.
I use pyarrow a lot and also a bit of polars. Mostly because pandas is slow. With the new 2.0 release, all three libraries are seamlessly connected to each other.
https://datapythonista.me/blog/pandas-20-and-the-arrow-revolution-part-i
Quite useful.
I use pyarrow a lot and also a bit of polars. Mostly because pandas is slow. With the new 2.0 release, all three libraries are seamlessly connected to each other.
https://datapythonista.me/blog/pandas-20-and-the-arrow-revolution-part-i
#data
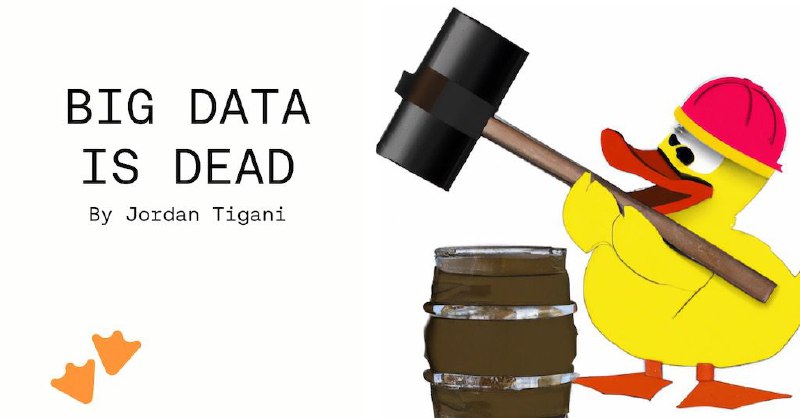
In physics, people claim that more is different. In the data world, more is very different. I'm no expert in big data, but I learned the scaling problem only when I started working for corporates.
I like the following from the author.
> data sizes increase much faster than compute sizes.
In deep learning, many models are following a scaling law of performance and dataset size. Indeed, more data brings in better performance. But the increase in performance becomes really slow. Business doesn't need a perfect model. We also know computation costs money. At some point, we simply have to cut the dataset, even if we have all the data in the world.
So ..., data hoarding is probably fine, but our models might not need that much.
https://motherduck.com/blog/big-data-is-dead/
#data
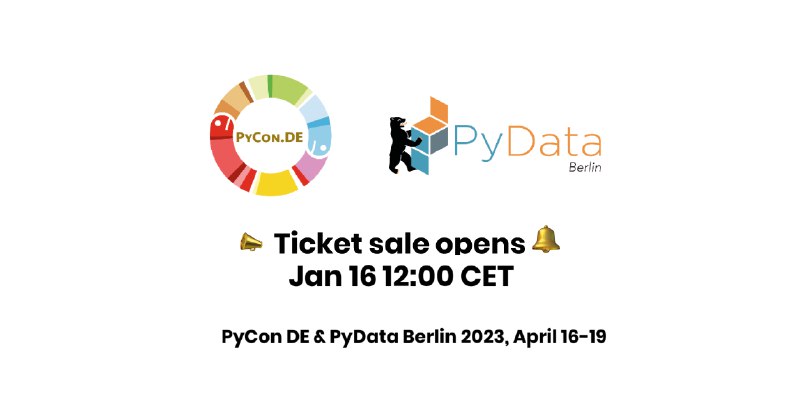
Just got my ticket.
I have been reviewing proposals for PyData this year. I saw some really cool proposals so I finally decided to attend the conference.
https://2023.pycon.de/blog/pyconde-pydata-berlin-tickets/
Just got my ticket.
I have been reviewing proposals for PyData this year. I saw some really cool proposals so I finally decided to attend the conference.
https://2023.pycon.de/blog/pyconde-pydata-berlin-tickets/
#data
https://evidence.dev/
I like the idea. My last dashboarding tool for work was streamlit. Streamlit is lightweight and fast. But it requires Python code and a Python server.
Evidence is mostly markdown and SQL. For many lightweight dashboarding tasks, this is just sweet.
Evidence is built on node. I could run a server and provide live updates but I can already build a static website by running
Played with it a bit. Nothing to complain about at this point.
https://evidence.dev/
I like the idea. My last dashboarding tool for work was streamlit. Streamlit is lightweight and fast. But it requires Python code and a Python server.
Evidence is mostly markdown and SQL. For many lightweight dashboarding tasks, this is just sweet.
Evidence is built on node. I could run a server and provide live updates but I can already build a static website by running
npm run build.Played with it a bit. Nothing to complain about at this point.
#data
If you are building a simple dashboard using python, streamlit is a great tool to get started. One of the problems in the past was to create multipage apps.
To solve this problem, I created a template for multipage apps a year ago.
https://github.com/emptymalei/streamlit-multipage-template
But today, streamlit officially introduced multipage support. And it looks great. I haven’t built any dashboards for a while, but to me, this is still the go-to solution for a dashboard.
https://blog.streamlit.io/introducing-multipage-apps/
#data
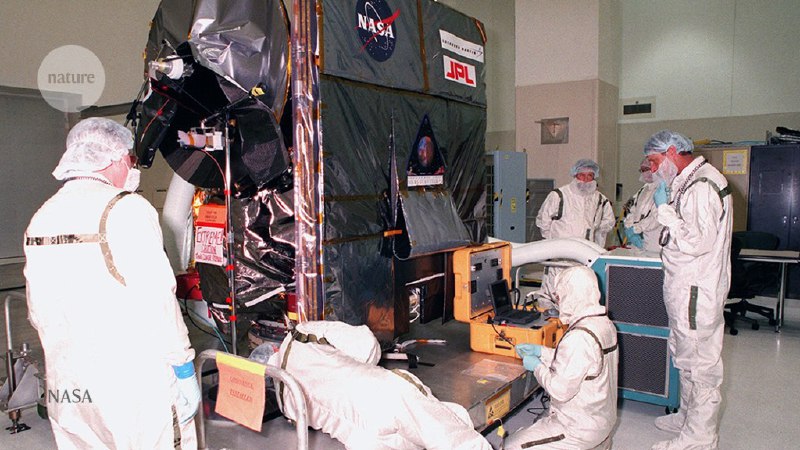
Stop squandering data: make units of measurement machine-readable
https://www.nature.com/articles/d41586-022-01233-w
Stop squandering data: make units of measurement machine-readable
https://www.nature.com/articles/d41586-022-01233-w
#data #ds
Disclaimer: I'm no expert in state diagram nor statecharts.
It might be something trivial but I find this useful: Combined with some techniques in statecharts (something frontend people like a lot), state diagram is a great way to document what our data is going through in data (pre)processing.
For complicated data transformations, we can make the corresponding state diagram and follow your code to make sure it is working as expected. The only thing is that we are focusing on the state of data not any other system.
We can use some techniques from statecharts, such as hierarchies and parallels.
State diagram is better than flowchart in this scenario because we are more interested in the different states of the data. State diagrams automatically highlights the states and we can easily spot the relevant part in the diagram and we don’t have to start from the beginning.
I documented some data transformations using state diagrams already. I haven't tired but it might also help us document our ML models.
References:
1. https://statecharts.dev
2. https://en.wikipedia.org/wiki/State_diagram