
Machine learning and other gibberish
See also: https://sharing.leima.is
Archives: https://datumorphism.leima.is/amneumarkt/
See also: https://sharing.leima.is
Archives: https://datumorphism.leima.is/amneumarkt/
#visualization
I like this. I was testing visualization using antv's G6. It is not for data analysis as it is quite tedious to generate visualizations.
Observable's plot is a mucheasier fluent package for data analysis.
https://github.com/observablehq/plot
I like this. I was testing visualization using antv's G6. It is not for data analysis as it is quite tedious to generate visualizations.
Observable's plot is a much
https://github.com/observablehq/plot
#career
Comment: Same for many competitive careers
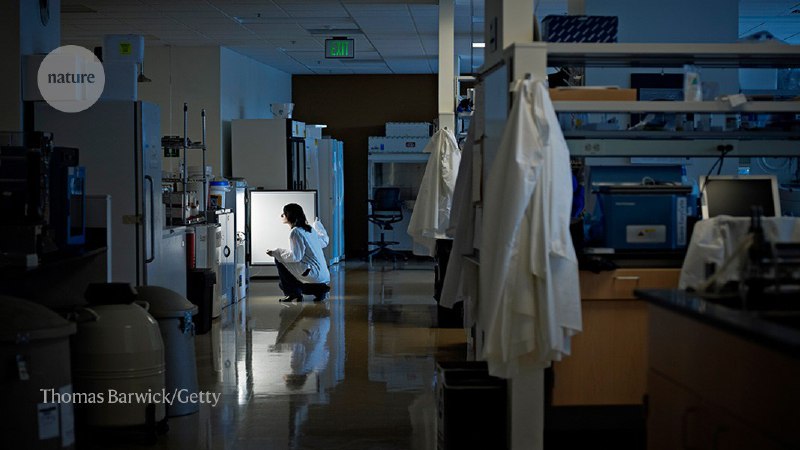
Beware survivorship bias in advice on science careers
https://www.nature.com/articles/d41586-021-02634-z
Comment: Same for many competitive careers
Beware survivorship bias in advice on science careers
https://www.nature.com/articles/d41586-021-02634-z
#ML
scikit learn reached 1.0. Nothing exciting about these new stuff but the major release probably means something.
Release Highlights for scikit-learn 1.0 — scikit-learn 1.0 documentation
http://scikit-learn.org/stable/auto_examples/release_highlights/plot_release_highlights_1_0_0.html
scikit learn reached 1.0. Nothing exciting about these new stuff but the major release probably means something.
Release Highlights for scikit-learn 1.0 — scikit-learn 1.0 documentation
http://scikit-learn.org/stable/auto_examples/release_highlights/plot_release_highlights_1_0_0.html
#ML #fun
I read about the story of using tensorflow in google translate [^Pointer2019].
> … Google Translate. Originally, the code that handled translation was a weighty 500,000 lines of code. The new, TensorFlow-based system has approximately 500, and it performs better than the old method.
This is crazy. Think about the maintenance of the code. A single person easily maintains 500 lines of code. 500,000 lines? No way.
Reference:
[^Pointer2019]: Pointer I. Programming PyTorch for Deep Learning: Creating and Deploying Deep Learning Applications. O’Reilly Media; 2019.
#ML
Phys. Rev. X 11, 031059 (2021) - Statistical Mechanics of Deep Linear Neural Networks: The Backpropagating Kernel Renormalization
https://journals.aps.org/prx/abstract/10.1103/PhysRevX.11.031059
Phys. Rev. X 11, 031059 (2021) - Statistical Mechanics of Deep Linear Neural Networks: The Backpropagating Kernel Renormalization
https://journals.aps.org/prx/abstract/10.1103/PhysRevX.11.031059
#visualization
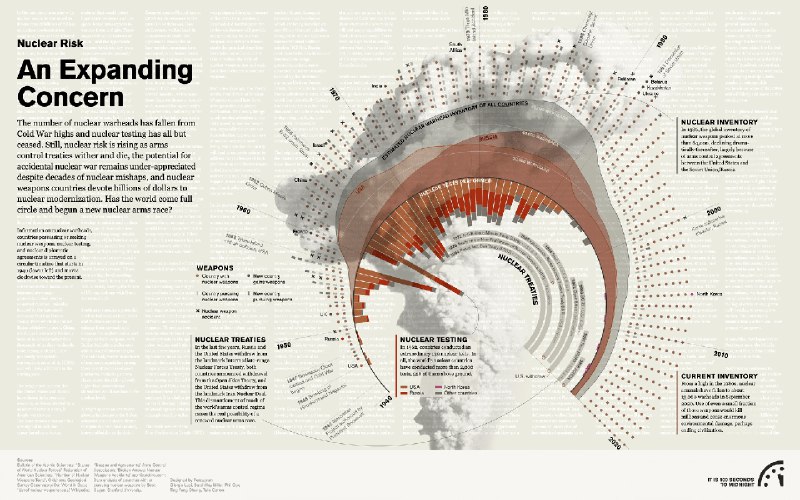
The Doomsday Datavisualizations - Bulletin of the Atomic Scientists
https://thebulletin.org/doomsday-clock/datavisualizations/
The Doomsday Datavisualizations - Bulletin of the Atomic Scientists
https://thebulletin.org/doomsday-clock/datavisualizations/

#ML
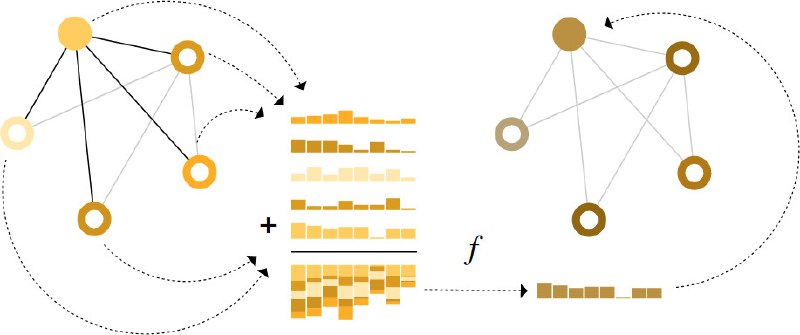
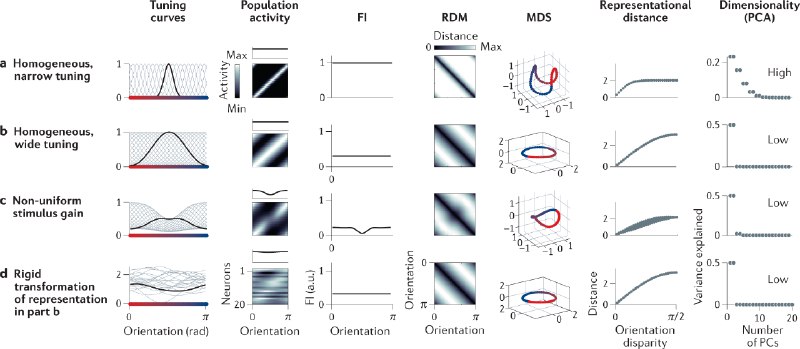
The authors investigate the geometry formed by the responses of neurons for certain stimulations (tunning curve). Using stimulation as the hidden variable, we can construct a geometry of neuron responses. The authors clarified the relations between this geometry and other measurements such as mutual information.
The story itself in this paper may not be interesting to machine learning practitioners. But the method of using the geometry of neuron responses to probe the brain is intriguing. We may borrow this method to help us with the internal mechanism of neural networks.
Kriegeskorte, Nikolaus, and Xue-Xin Wei. 2021. “Neural Tuning and Representational Geometry.” Nature Reviews. Neuroscience, September. https://doi.org/10.1038/s41583-021-00502-3.
#ML #self-supervised #representation
Contrastive loss is widely used in representation learning. However, the mechanism behind it is not as straightforward as it seems.
Wang & Isola proposed a method to rewrite the contrastive loss in to alignment and uniformity. Samples in the feature space are normalized to unit vectors. These vectors are allocated onto a hypersphere. The two components of the contrastive loss are
- alignment, which forces the positive samples to be aligned on the hypersphere, and
- uniformity, which distributes the samples uniformly on the hypersphere.
By optimization of such objectives, the samples are distributed on a hypersphere, with similar samples clustered, i.e., pointing to the similar directions. Uniformity makes sure the samples are using the whole hypersphere so we don't waste "space".
References:
Wang T, Isola P. Understanding Contrastive Representation Learning through Alignment and Uniformity on the Hypersphere. arXiv [cs.LG]. 2020. Available: http://arxiv.org/abs/2005.10242
#中文 #visualization
看到 TMS channel 推荐的 data stiches,
https://datastitches.substack.com/
关注了几期,感觉质量非常好,经常能看到很棒的作品。
同时推荐一下 TMS channel
https://t.me/tms_ur_way/1031
关于时间管理,效率,和人生。
看到 TMS channel 推荐的 data stiches,
https://datastitches.substack.com/
关注了几期,感觉质量非常好,经常能看到很棒的作品。
同时推荐一下 TMS channel
https://t.me/tms_ur_way/1031
关于时间管理,效率,和人生。
#DS
Cute comics on interactive data visualization
https://hdsr.mitpress.mit.edu/pub/49opxv6v/release/1
Cute comics on interactive data visualization
https://hdsr.mitpress.mit.edu/pub/49opxv6v/release/1
#ML
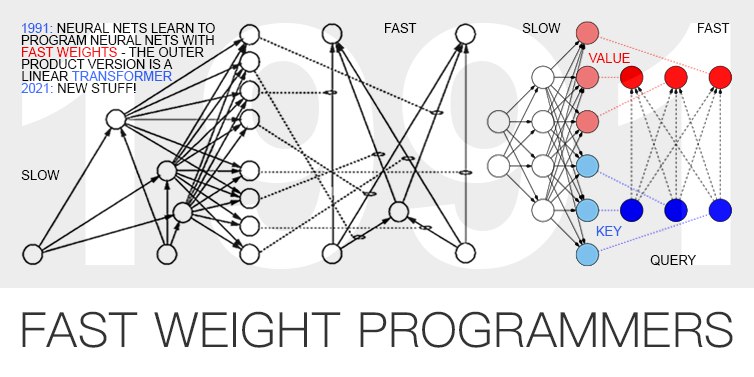
😂
Jürgen Schmidhuber invented transformers in the 90s.
https://people.idsia.ch/~juergen/fast-weight-programmer-1991-transformer.html
😂
Jürgen Schmidhuber invented transformers in the 90s.
https://people.idsia.ch/~juergen/fast-weight-programmer-1991-transformer.html

#DS
Hullman J, Gelman A. Designing for interactive exploratory data analysis requires theories of graphical inference. Harvard Data Science Review. 2021. doi:10.1162/99608f92.3ab8a587
https://hdsr.mitpress.mit.edu/pub/w075glo6/release/2
Creating visualizations seems to be a creative task. At least for entry-level visualization tasks, we follow our hearts and build whatever is needed. However, visualizations are made for different purposes. Some visualizations are simply explorations and for us to get some feelings on the data. Some others are built for the validation of hypotheses. These are very different things.
Confirmation of an idea using charts is usually hard. In most cases, we need statistical tests to (dis)prove a hypothesis instead of just looking at the charts. Thus, visualizations become a tool to help us formulate a good question.
However, not everyone is using charts as hints only. Instead, many use charts to conclude. As a result, even experienced analysts draw spurious conclusions. These so-called insights are not going to be too solid.
The visual analysis seems to be an adversarial game between humans and the visualizations. There are many different models for this process. A crude and probably stupid model can be illustrated through an example of analysis by the histogram of a variable.
The histogram looks like a bell. It is symmetric. It is centered at 10 with an FWHM of 2.6. I guess this is a Gaussian distribution with a mean 10 and sigma 1. This is the posterior p(model | chart).
Imagine a curve like what was just guessed on top of the original curve. Would my guess and the actual curve overlap with each other?
If not, what do we have to adjust? Do we need to introduce another parameter?
Guess the parameter of the new distribution model and compare it with the actual curve again.
The above process is very similar to a repetitive Bayesian inference. Though, the actual analysis may be much more complicated as the analysts would carrier a lot of prior knowledge about the generating process of the data.
Through this example, we see that integrating explorations with preliminary model building as Confirmatory Data Analysis may bring in more confidence in drawing insights from charts.
On the other hand, including complicated statistical models leads to misinterpretations since not everyone is familiar with statistical hypothesis testing. So the complexity has to be balanced.
#ML
https://www.microsoft.com/en-us/research/blog/make-every-feature-binary-a-135b-parameter-sparse-neural-network-for-massively-improved-search-relevance/
Though not the core of the model, I noticed that this model (MEB) uses the user search behavior on Bing to build the language model. If a search result on Bing is clicked by the user, it is considered to be a positive sample for the query, otherwise a negative sample.
In self-supervised learning, it has been shown that negative sampling is extremely important. This Bing search dataset is naturally labeling the positive and negative samples. Kuhl idea.

#science
Nielsen M. Reinventing discovery: The New Era of networked science. Princeton, NJ: Princeton University Press; 2011.
I found this book this morning and skimmed through it. It looks concise yet unique.
The author discusses how the internet is changing the way human beings think as one collective intelligence. I like the chapters about how the data web is enabling more scientific discoveries.
#ML
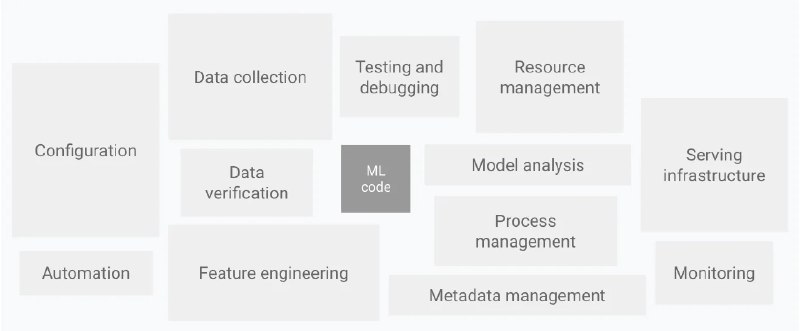
https://thegradient.pub/systems-for-machine-learning/
challenges in data collection, verification, and serving tasks
https://thegradient.pub/systems-for-machine-learning/
challenges in data collection, verification, and serving tasks