
Machine learning and other gibberish
See also: https://sharing.leima.is
Archives: https://datumorphism.leima.is/amneumarkt/
See also: https://sharing.leima.is
Archives: https://datumorphism.leima.is/amneumarkt/
#visualization
Seaborn is getting a new interface.
Would be great if the author defines a dunder method _ _ add _ _ () instead of using .add() method. Using dunder add, we can simply use + on layers.
Nevertheless, we can all move away from plotnine when the migration is done.
https://seaborn.pydata.org/nextgen/
Seaborn is getting a new interface.
Would be great if the author defines a dunder method _ _ add _ _ () instead of using .add() method. Using dunder add, we can simply use + on layers.
Nevertheless, we can all move away from plotnine when the migration is done.
https://seaborn.pydata.org/nextgen/
Deepnote supports Great Expectations (GE) now.
I ran their template notebook:
https://deepnote.com/project/Reduce-Pipeline-Debt-With-Great-Expectations-mLT9DFCQSpW4kUBAzzdhBw/%2Fnotebook.ipynb/#00000-e170fae0-7e06-4a7a-85f3-343584ec4b94
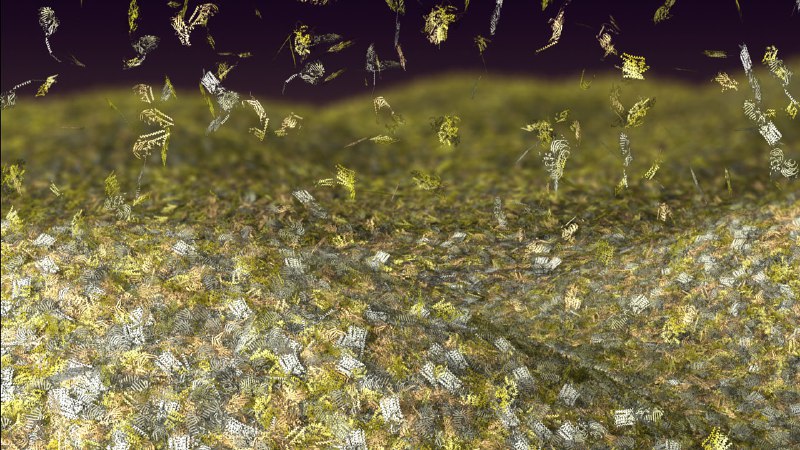
Beautiful, elegant, and informative. It reminds me of the Netflix movie chromatic storytelling visualization.
Full image:
https://zenodo.org/record/5828349
Other discussions:
https://www.reddit.com/r/dataisbeautiful/comments/s6vh8k/dutch_astronomer_cees_bassa_took_a_photo_of_the/
#python
I thought it was a trivial talk in the beginning.
But I quickly realized that I may know every each piece of the code mentioned in the video but the philosophy is what makes it exciting.
He talked about some fundamental ideas of Python, e.g., protocols.
After watching this video, an idea came to me. Pytorch lightning has implanted a lot of hooks in a very pythonic way. This is what makes pytorch lightning easy to use. (So if you do a lot of machine learning experiments, pytorch lightning is worth a try.)
https://youtu.be/cKPlPJyQrt4
#data #ds
Disclaimer: I'm no expert in state diagram nor statecharts.
It might be something trivial but I find this useful: Combined with some techniques in statecharts (something frontend people like a lot), state diagram is a great way to document what our data is going through in data (pre)processing.
For complicated data transformations, we can make the corresponding state diagram and follow your code to make sure it is working as expected. The only thing is that we are focusing on the state of data not any other system.
We can use some techniques from statecharts, such as hierarchies and parallels.
State diagram is better than flowchart in this scenario because we are more interested in the different states of the data. State diagrams automatically highlights the states and we can easily spot the relevant part in the diagram and we don’t have to start from the beginning.
I documented some data transformations using state diagrams already. I haven't tired but it might also help us document our ML models.
References:
1. https://statecharts.dev
2. https://en.wikipedia.org/wiki/State_diagram
Pu X, Kay M. A probabilistic grammar of graphics. Proceedings of the 2020 CHI Conference on Human Factors in Computing Systems. New York, NY, USA: ACM; 2020. doi:10.1145/3313831.3376466
Available at: https://dl.acm.org/doi/10.1145/3313831.3376466
A very good read if you are visualizing probability densities a lot.
The paper began with a common mistake people make when visualizing densities. Then they proposed a systematic grammar of graphics for probabilities. They also provide a package (quite preliminary, see here https://github.com/MUCollective/pgog ).
#ml #science
I remember several years ago when I was still doing my PhD, there's this contest about predicting protein structure and none of them was working well. At that time, I would never have thought we could have anything like AlphaFold in a few years.
.
https://www.science.org/content/article/breakthrough-2021
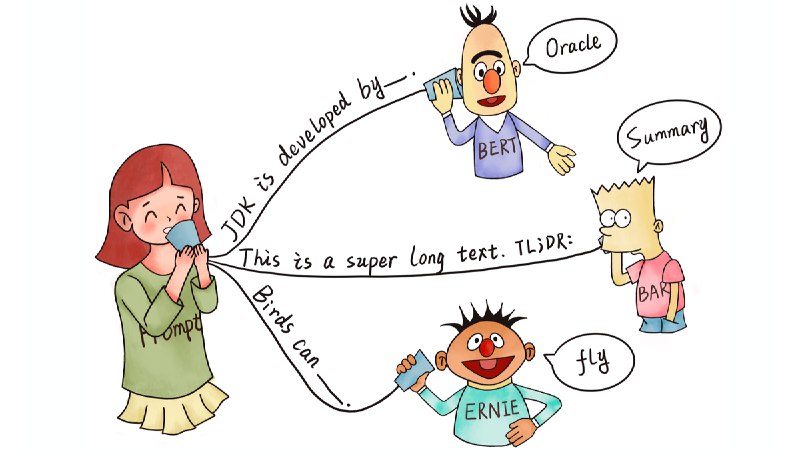
#ML #Transformers
Alammar J. The Illustrated Transformer. [cited 14 Dec 2021]. Available: http://jalammar.github.io/illustrated-transformer/
So good.
Alammar J. The Illustrated Transformer. [cited 14 Dec 2021]. Available: http://jalammar.github.io/illustrated-transformer/
So good.
#DS #visualization
https://percival.ink/
A new lightweight language for data analysis and visualization. It looks promising.
I hate jupyter notebooks and I don't use them on most of my projects. One of the reasons is low reproducibility due to its non-reative nature. You changed some old cells and forgot to run a cell below, you may read wrong results.
This new language is reactive. If old cells are changed, related results are also updated.
#ml #rl
How to Train your Decision-Making AIs
https://thegradient.pub/how-to-train-your-decision-making-ais/
The author reviewed "five types of human guidance to train AIs: evaluation, preference, goals, attention, and demonstrations without action labels".
The last one reminds me of the movie Finch. In the movie, Finch was teaching the robot to walk by demonstrating walking but without "labels".

Hmmm my plate is way off the planetary heath diet recommendation.
Source:
https://www.nature.com/articles/d41586-021-03612-1
#DS
Just in case you are also struggling with Python packages on Apple M1 Macs
I am using the third option: anaconda + miniforge.
https://www.anaconda.com/blog/apple-silicon-transition
Just in case you are also struggling with Python packages on Apple M1 Macs
I am using the third option: anaconda + miniforge.
https://www.anaconda.com/blog/apple-silicon-transition

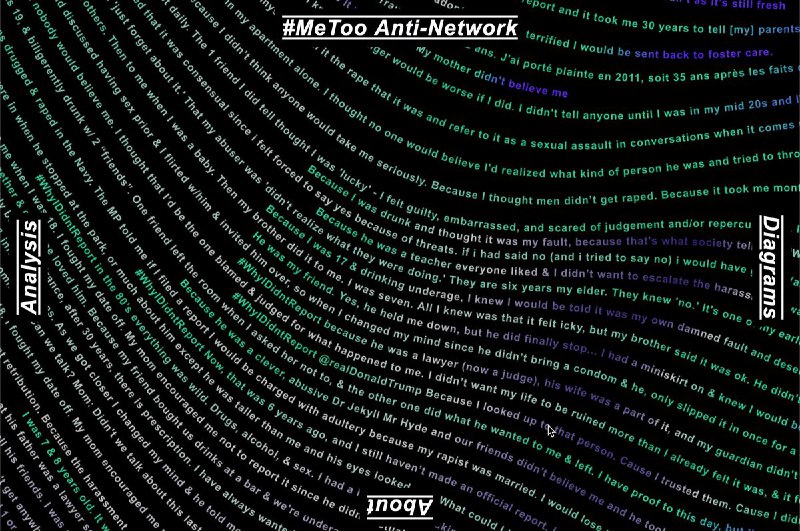
11月25号是消除对妇女的暴力行为国际日,来自metaLab的研究人员在随机选择一百万条#MeToo推文后,仔细阅读了转发次数超过 100 次的示例,在894 条推文中只有 8 条是关于性侵犯或围绕#MeToo主题的经历的实际推文,其余绝大多数是新闻媒体和政治讨论,其中大多数都忽略了#MeToo运动核心的具体问题和幸存者的声音,设计师Kim Albrecht想通过这个可视化项目来展示被忽视的针对女性暴力问题
#ML
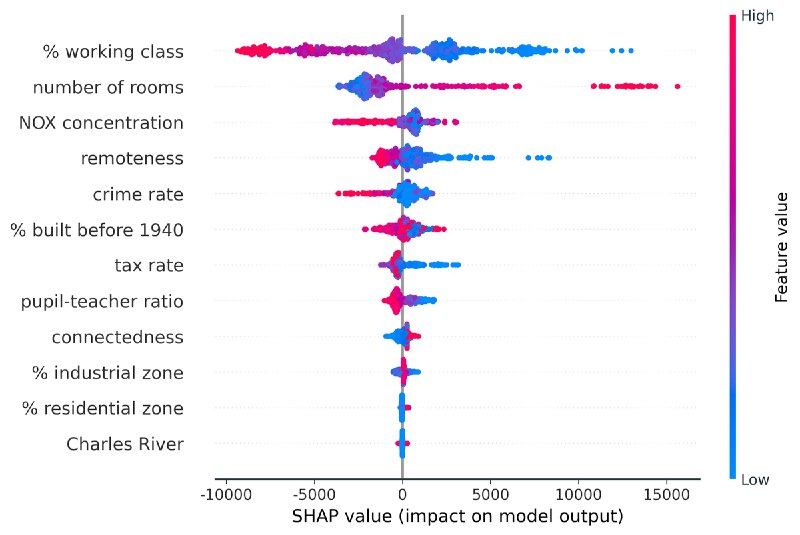
SHAP (SHapley Additive exPlanations) is a system of methods to interpret machine learning models.
The author of SHAP built an easy-to-use package to help us understand how the features are contributing to the machine learning model predictions. The package comes with a comprehensive tutorial for different machine learning frameworks.
- Python Package: [slundberg/shap](https://shap.readthedocs.io/)
- A tutorial on how to use it: https://www.aidancooper.co.uk/a-non-technical-guide-to-interpreting-shap-analyses/
---
The package is so popular and you might be using it already. So what is SHAP exactly? It is a series of methods based on Shapley values.
> SHAP (SHapley Additive exPlanations) is a game-theoretic approach to explain the output of any machine learning model.
>
> -- [slundberg/shap](https://github.com/slundberg/shap)
Regarding Shapley value: There are two key ideas in calculating a Shapley value.
- A method to measure the contribution to the final prediction of some certain combination of features.
- A method to combine these "contributions" into a score.
SHAP provides some methods to estimate Shapley values and also for different models.
The following two pages explain Shapley value and SHAP thoroughly.
- https://christophm.github.io/interpretable-ml-book/shap.html
- https://christophm.github.io/interpretable-ml-book/shapley.html
References:
- Lundberg SM, Lee SI. A unified approach to interpreting model predictions. of the 31st international conference on neural …. 2017. Available: http://papers.nips.cc/paper/2017/file/8a20a8621978632d76c43dfd28b67767-Paper.pdf
- Lundberg SM, Nair B, Vavilala MS, Horibe M, Eisses MJ, Adams T, et al. Explainable machine-learning predictions for the prevention of hypoxaemia during surgery. Nature Biomedical Engineering. 2018;2: 749–760. doi:10.1038/s41551-018-0304-0
---
I posted [a similar article years ago in our Chinese data weekly newsletter](https://github.com/data-com/weekly/discussions/27) but for a different story.